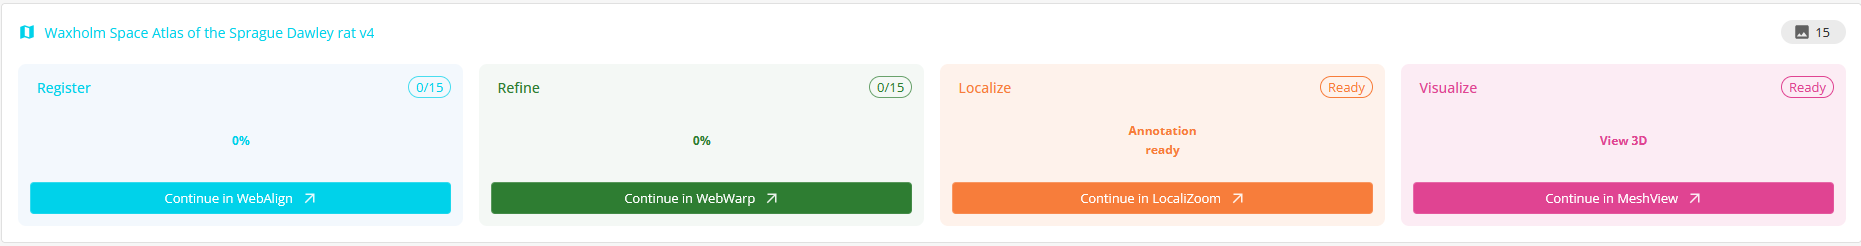
LocaliZoom viewer and annotation tool
LocaliZoom is the next step in the workflow where you can annotate points of interest in your images. As for the other apps, you can use the tab on top of the page or access LocaliZoom from the project page.
Basic operations
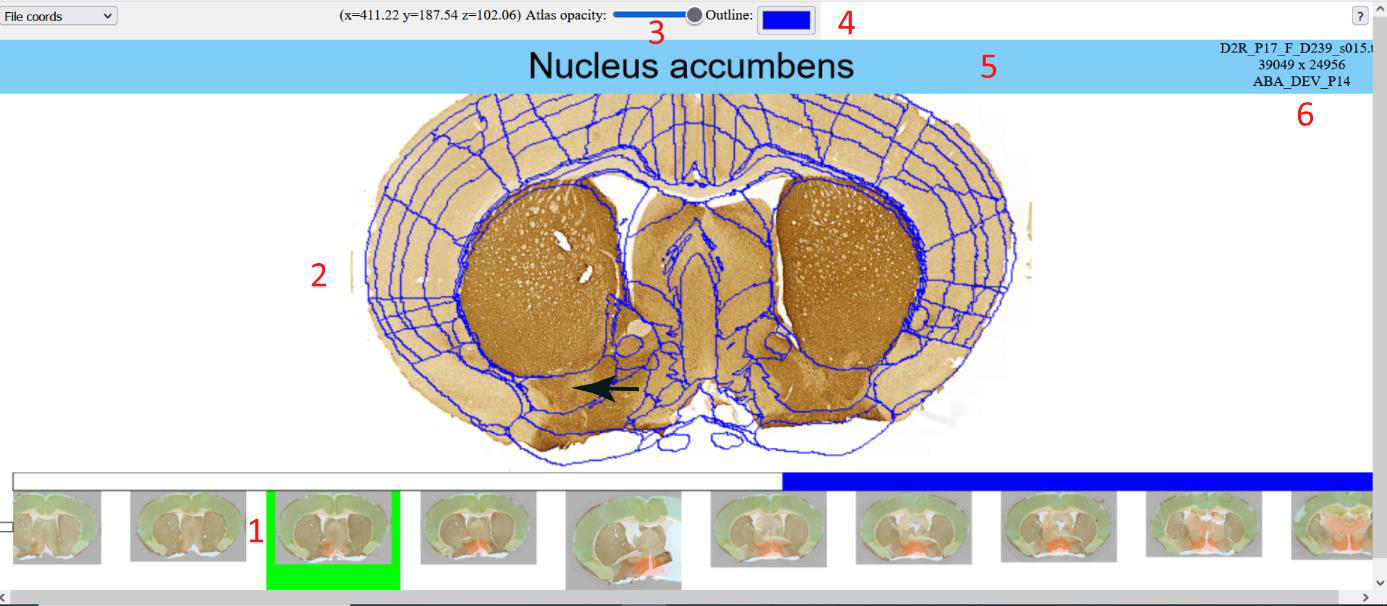
In LocaliZoom viewer, serial section images (1) are represented in a filmstrip at the bottom of the webpage user interface, with the selected section image shown with an atlas overlay (2) in the main view.
In the upper panel, users can adjust the transparency of the atlas overlay (3) allowing them to see the experimental image and the atlas regions simultaneously. The outline appears when minimum transparency is selected. It is possible to change the colour of the outline (4) and see the name of the image file (6).
In the middle panel, the pointer of the mouse will show the atlas region name (5). The main image can be zoomed and panned.
Controls:
Pan and zoom with mouse drag and mouse scroll wheel
Step backwards and forwards in series with left and right arrow keys
Quick set segmentation transparency to minimum and back using down and up arrow keys
Drag an annotation marker to refine its position
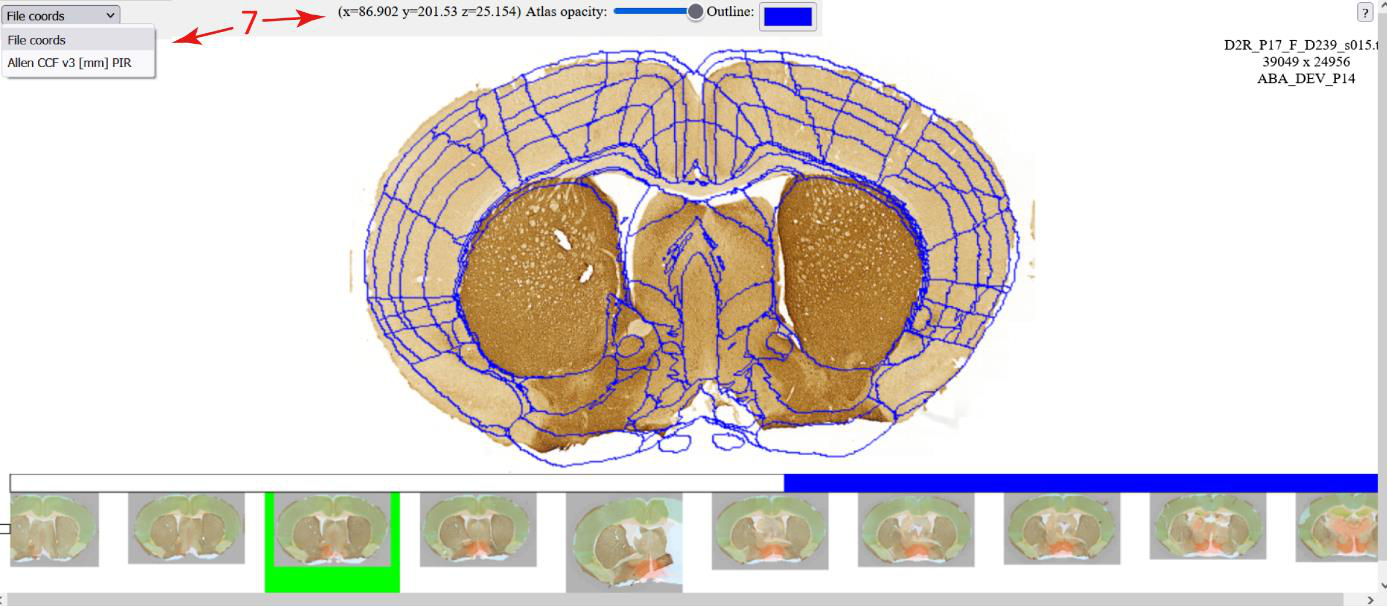
Coordinates of points
The user can visualise the coordinates of the mouse pointer (7) and switch between different coordinate spaces when available.
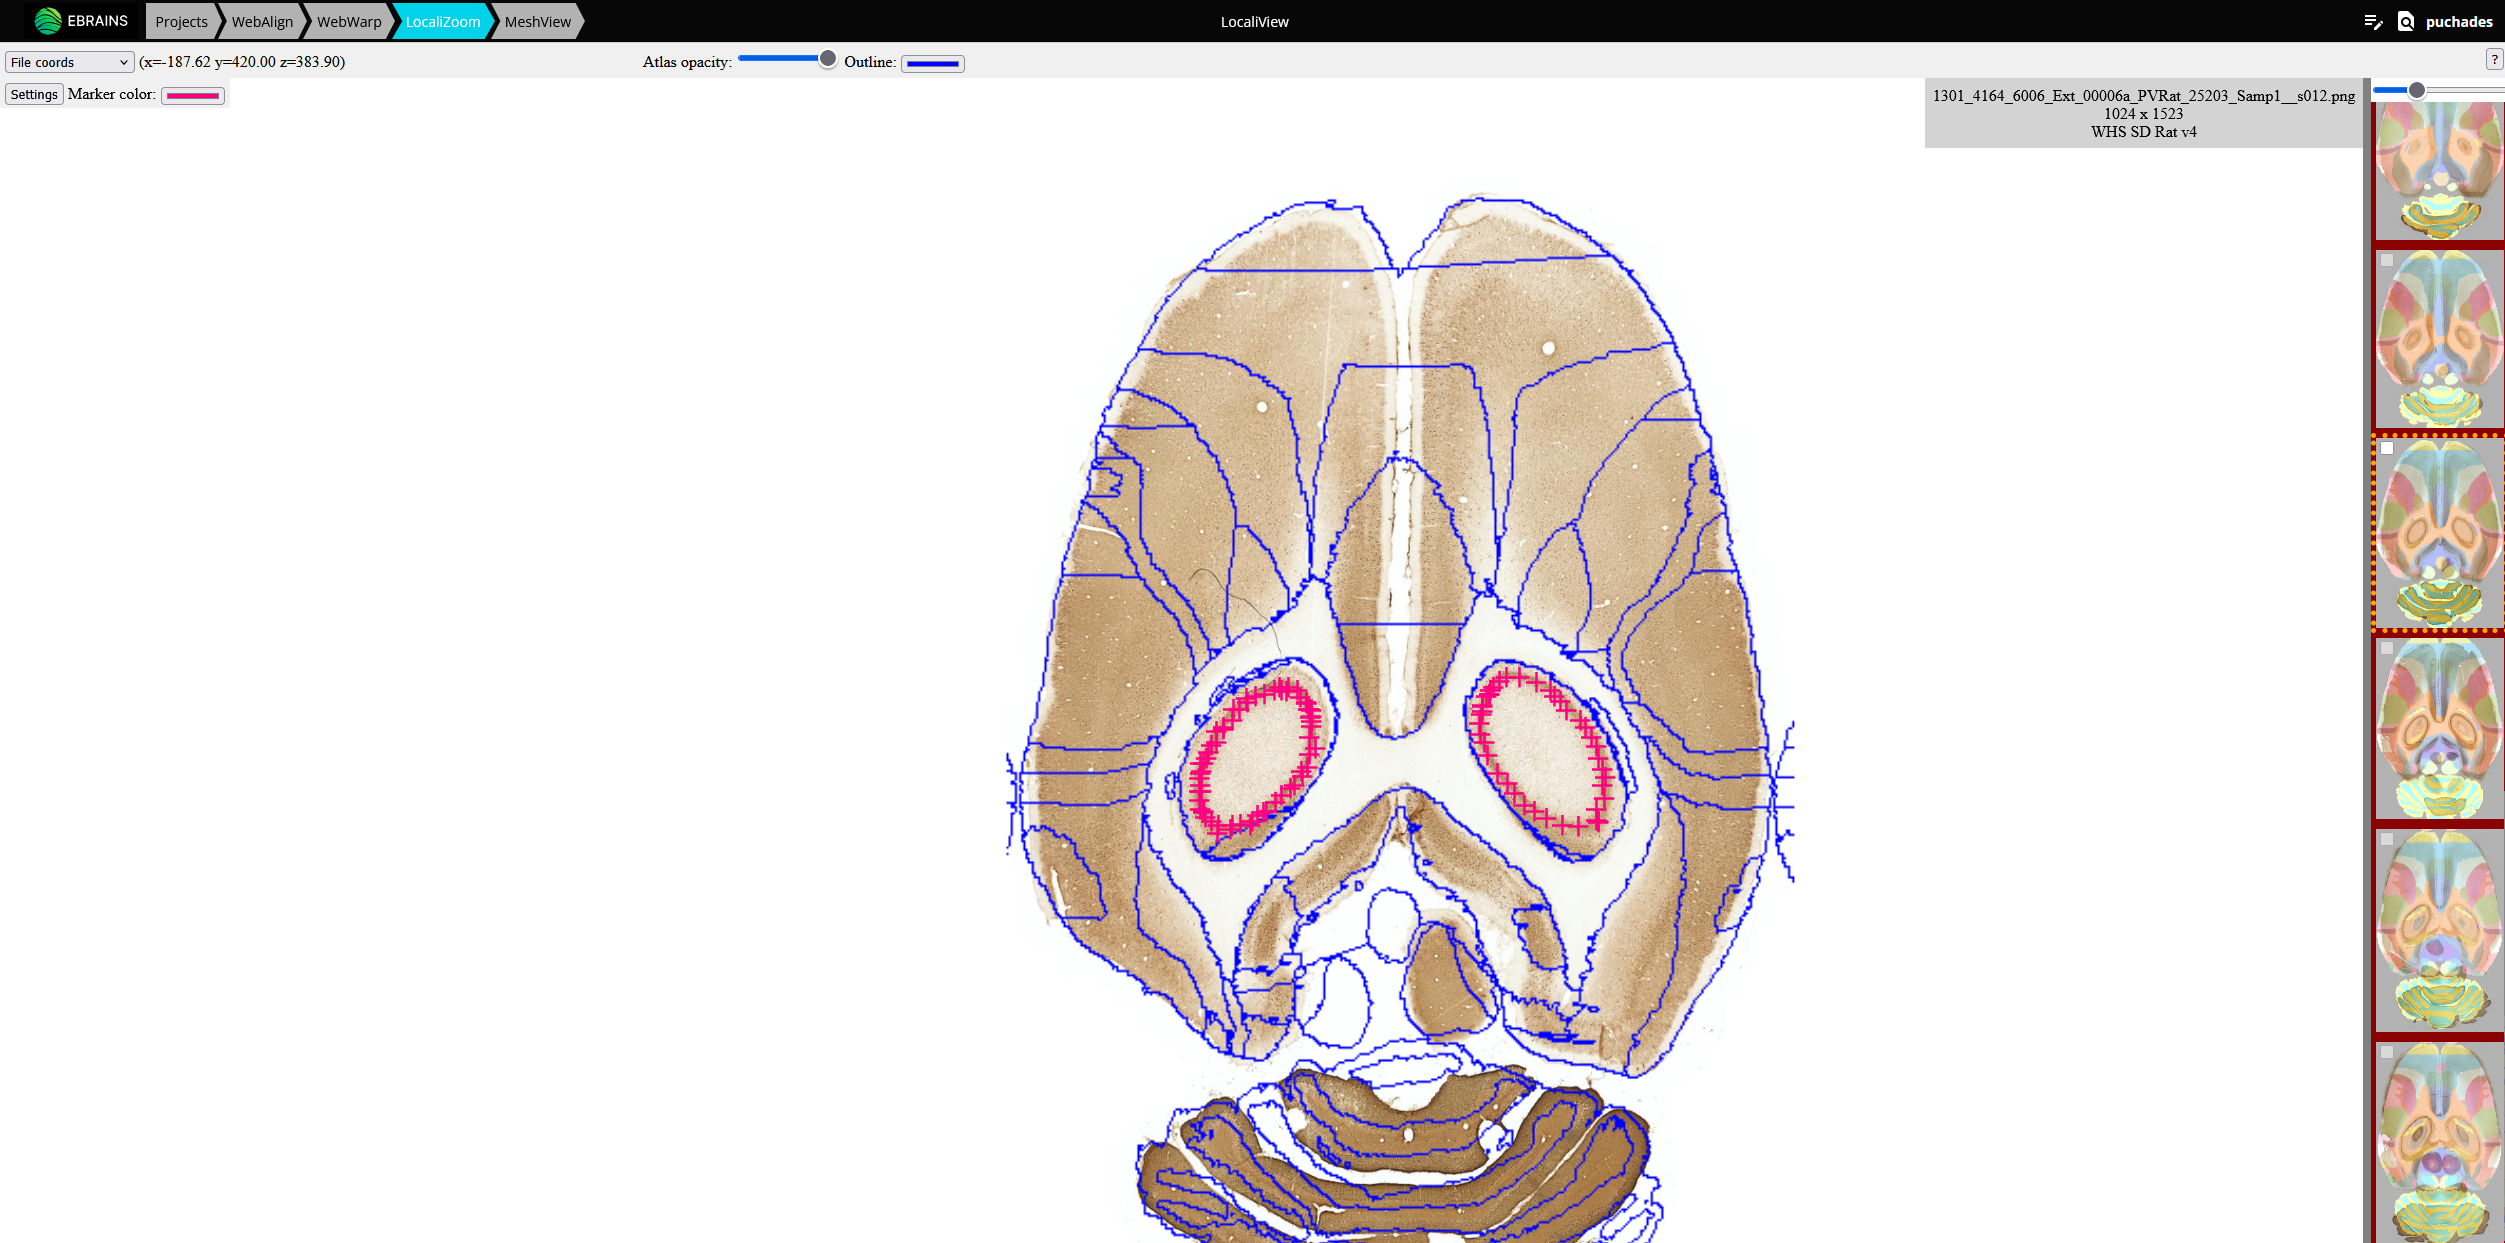
Annotations
The same basic viewing controls applies and in addition extraction of a limited number of coordinates, e.g. representing an electrode track or labelling within a small region of interest is possible. Users can inspect the images at cellular resolution and observe brain regions, names, and boundaries and annotate points in order to extract coordinates.
Use the webapp here: https://localiview.apps.ebrains.eu/
Dataset DOI: https://doi.org/10.25493/G6CQ-D4D
Controls:
Press Space to annotate points of interest. The color of the points can be changed by clicking on the “Settings button” and on the color.
Press Delete to remove an annotation marker under the mouse cursor
The points are saved automatically.
More details can be found here: https://localizoom.readthedocs.io/en/latest/index.html
Viewing point coordinates in MeshView
The saved points can be visualised in the 3D viewer, MeshView (https://meshview-for-brain-atlases.readthedocs.io/en/latest/index.html) which is also available in the LocaliView workbench.
Read more about MeshView here: https://meshview-for-brain-atlases.readthedocs.io/en/latest/